Global headquarters:
225 Broadway #660, New York, NY 10007
Canada Office:
21 King Street West, Ste 524 Hamilton, ON L8P 4W7
Take a look at additional functionality layered on top of our core software offering.
Broaden your ERP knowledge in more ways than one.
We know food and we have your industry covered.
+ Pre-packaged workspaces that are easy-to-use
+ Real-time actionable insights that are relevant to you
+ Worry-free automatic updates & maintenance
+ Tailored custom workspaces available upon request

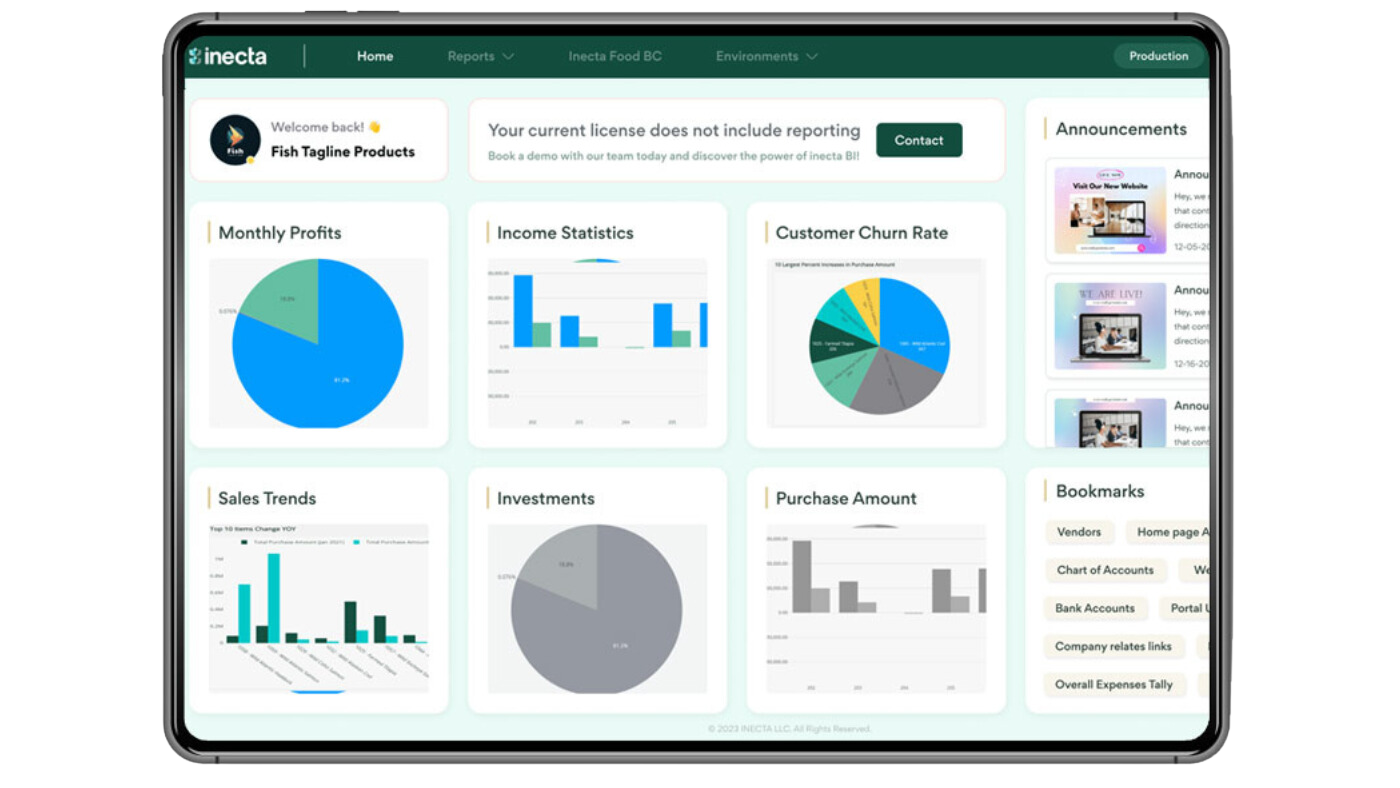
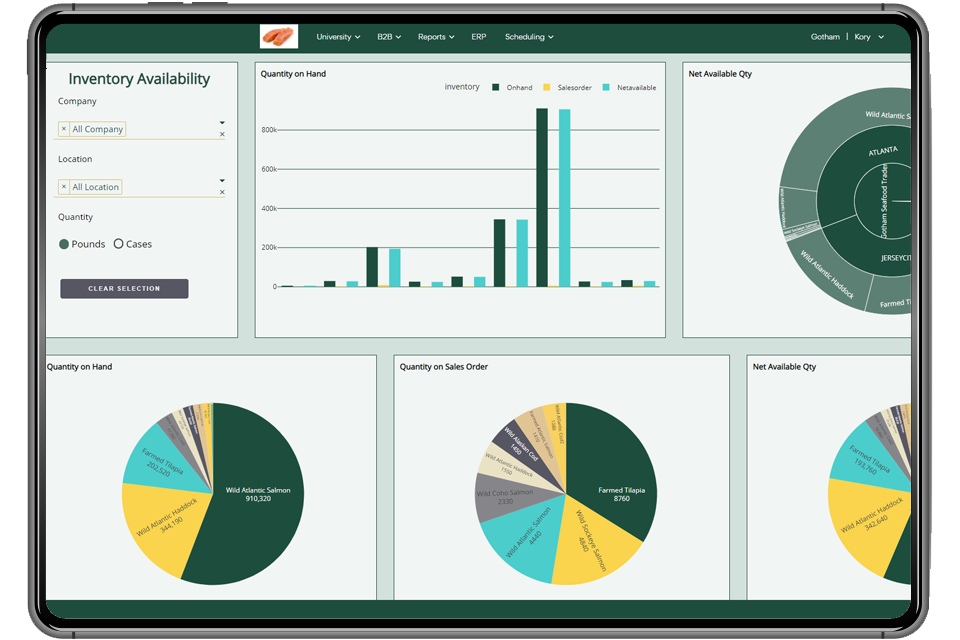
Our intuitive business intelligence reporting on food inventory offers real-time updates, historical data, and predictive data analytics, providing food businesses with the insights they need to optimize business performance and maximize profits.
Our comprehensive business intelligence reporting solution offers historical data, real-time analytics, and data visualizations to help CFOs and controllers manage finance data for multiple companies. With our solution, you can easily identify trends and patterns to make informed decisions that optimize your business operations. Additionally, our user-friendly interface allows you to create custom reports and data visualizations that provide deeper insights into your financial data.
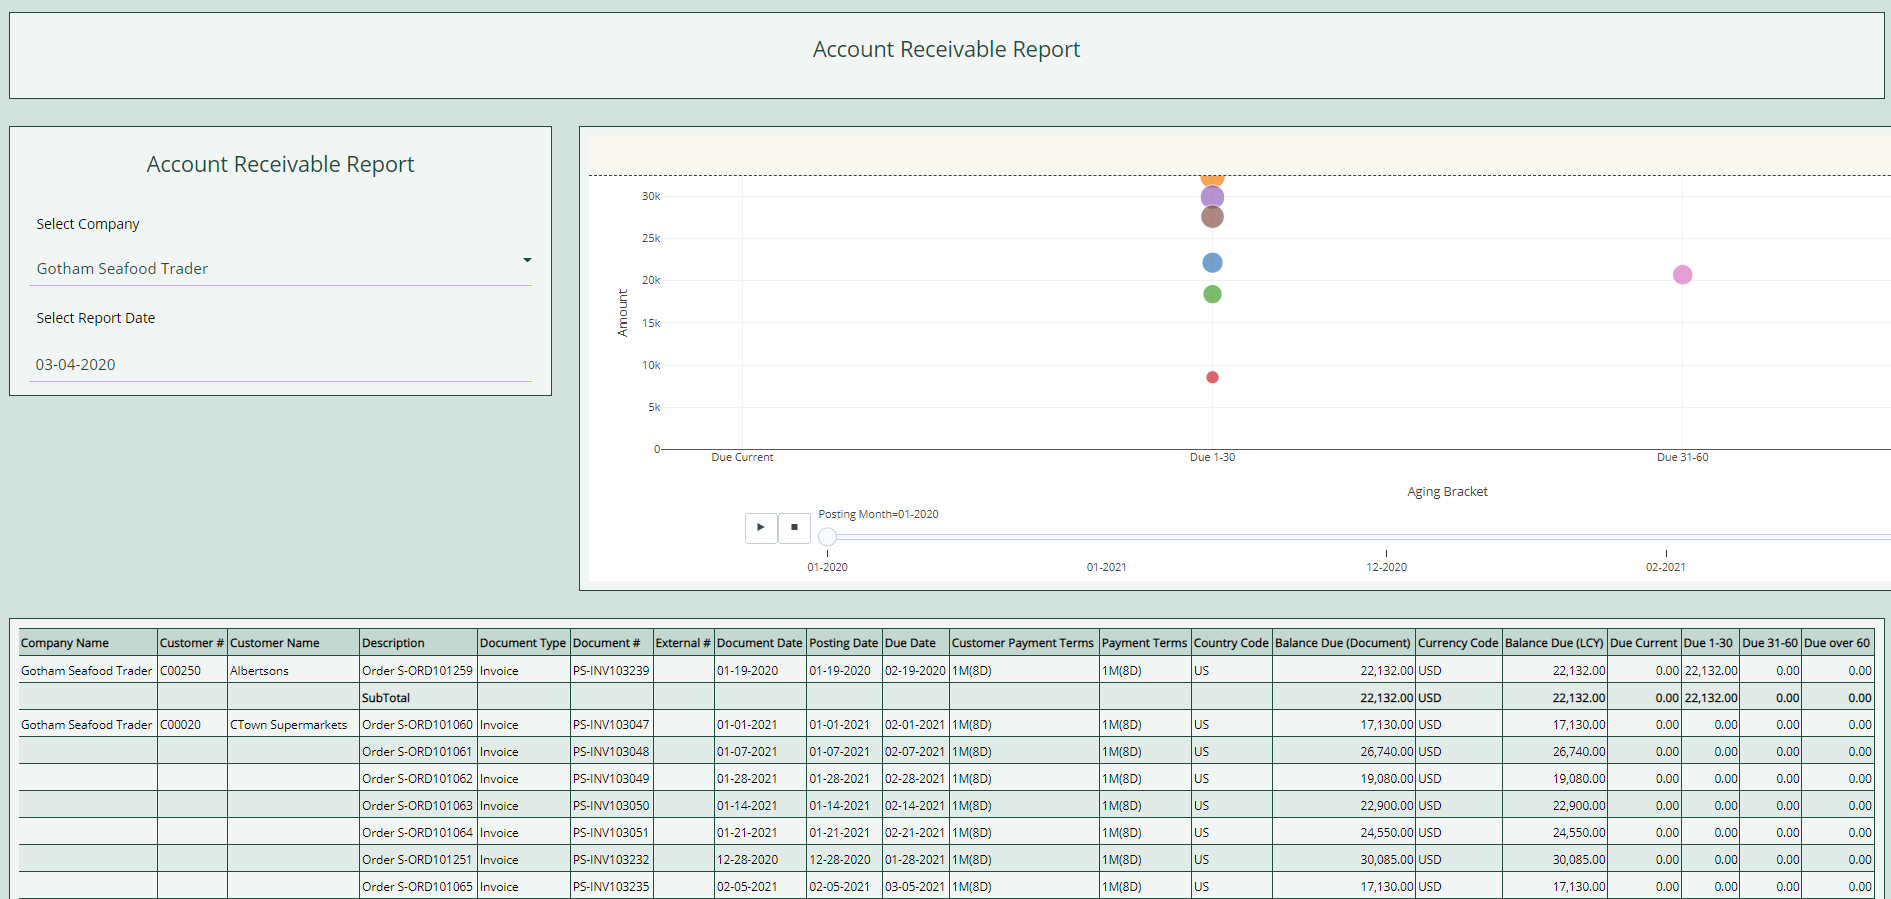
Our business intelligence reporting solution includes standard BI reporting and data analytics tools, allowing you to analyze data such as aged account receivables, customer statements, payment receipts, customer reconciliation, and sales statistics. With our comprehensive BI tools, you can easily generate business intelligence reports and gain valuable insights into your financial data.
Finance & Accounting Reports
Cash Application
Financial Data Analytics
Account Payables/Receivables
Finance Dashboard
Borrowing Base
Sales & Customer Service BI Reporting
Sales by Item Summary Monthly
Sales History by Customer Summary
Sales Overview
Sales Year-Over-Year
Sales Analysis Map
Profit Analysis (Profit Margin)
Gross Margin Vs Sales by Salesperson
Inventory Management Reports
Inventory Valuation
Inventory by Location Report
Inventory Availability
Inventory Expiration
Inventory Pivot
Inventory Aging
In-Stock Lot Summary by Case
Purchasing & Planning Reports
Purchase
Purchase History by Vendor
Purchases By Item
Vendor Item Statistics
Vessel Management & Fishing Reports
Vessel Status Report
Profit Margin
Workspaces, or collaborative digital environments, are designed to streamline team workflows, foster collaboration, and optimize productivity. These platforms enable teams to centralize communication, access shared files, manage tasks, and track project progress in one unified space. By consolidating resources and facilitating real-time collaboration, workspaces empower teams to work more efficiently and achieve their goals effectively.
Workspaces empower businesses to enhance decision-making by offering real-time insights into operations across various data sources. This enables businesses to pinpoint areas for improvement, cut costs, and boost revenue. Moreover, workspaces facilitate tracking of key performance indicators (KPIs) and monitoring progress toward objectives, leading to increased efficiency and productivity.
Numerous tools facilitate BI reporting, such as inecta Workspaces, Tableau, Power BI, QlikView, and SAP BusinessObjects. Each tool offers distinct advantages and limitations, requiring businesses to select based on their unique needs and insights criteria.
To generate an inecta Workspaces, begin by defining the data and questions for analysis. Collect data from diverse sources like databases and spreadsheets. Prepare the data for analysis, then utilize the tool to craft visualizations and reports for actionable insights.
Business intelligence reporting, like inecta Workspaces, benefits various industries. In healthcare, it analyzes patient data for improved outcomes. In retail, it tracks sales trends and optimizes inventory for better profitability.

225 Broadway #660, New York, NY 10007
21 King Street West, Ste 524 Hamilton, ON L8P 4W7
© 2025 inecta LLC. All rights reserved.